Forget the Funnel: Build an Influence Map That Actually Wins Customers

Forget the Funnel: Build an Influence Map That Actually Wins Customers
TL;DR
Journeys are non‑linear loops; funnels miss cross‑channel influence.
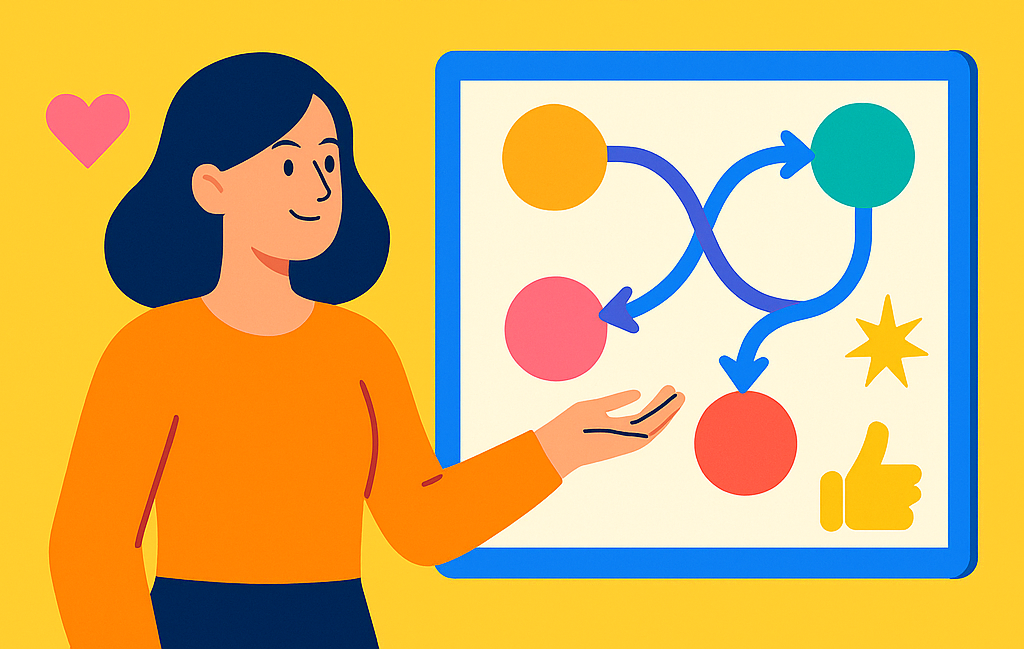
Consumers don’t move through awareness, consideration, and purchase in a tidy order anymore. They loop, bounce, and revisit across devices and contexts. Funnels describe intention; real life is chaos. Influence maps reveal what truly nudges decisions in this messy reality—helping you see which moments deserve investment.
Weight touchpoints by attention, relevance, and trust—not reach.
A touchpoint with a million impressions might matter less than one credible review read by a thousand. When planning, evaluate influence—not exposure. Attention, relevance, and trust are the real levers of persuasion. Map these signals to your channels and weight budgets accordingly.
Update the map quarterly with experiments and MMM findings.
Markets evolve fast; so should your map. Use Marketing Mix Modeling (MMM) and holdout experiments to test which touchpoints move the needle. Refresh your influence map quarterly, not annually, to stay aligned with shifting behaviors.
Why this matters now
For decades, marketers visualized the path to purchase as a funnel: wide at the top, narrow at the bottom, and predictable in between. That model worked when information was scarce and channels were few. Today, the funnel is obsolete. Customers research online while shopping offline, discover on TikTok, verify on Google, and decide on WhatsApp. The modern path is a web of micro‑moments—each capable of tipping the decision.
BCG’s research urges brands to move from funnel thinking to influence mapping. Instead of tracking stages, we track moments of persuasion. Think with Google’s “Messy Middle” studies echo the same: consumers oscillate between exploration and evaluation in loops, not lines. Influence mapping captures this dynamic, showing where confidence is won—or lost.
This shift isn’t just semantic; it’s strategic. Influence mapping reframes planning around what actually changes minds. Funnels assume progression; influence maps measure momentum.
What to do this month
- [ ] Inventory every touchpoint. Start with all your owned, earned, and paid channels—from ads and search results to reviews, chats, and in‑store displays.
- [ ] Score each on attention, relevance, and trust. Attention tells you if people notice. Relevance tells you if it fits their need. Trust tells you if they believe it. Assign simple 1–5 scores based on research, surveys, or behavioral data.
- [ ] Run geo‑ or audience‑based holdouts. Pause specific touchpoints for a region or segment and measure the lift loss. This isolates which nodes actually influence decisions.
- [ ] Shift 10–20% of your media budget into high‑influence touchpoints and re‑evaluate quarterly. Influence mapping is iterative: every quarter brings new behaviors and new leverage points.
- [ ] Visualize it. Build an actual map using Miro, FigJam, or a spreadsheet. Connect touchpoints by flow (what usually follows what) and size the nodes by influence. Clarity invites smarter planning.
Evidence & caveats
BCG’s “Beyond the Funnel” analysis finds that traditional funnel modeling underestimates the impact of mid‑journey content like reviews, search results, and short‑form video. These assets often influence final conversion far more than awareness spend.
Think with Google’s “Messy Middle” studies showed that brands which stay present in the exploration‑evaluation loop are up to 2x more likely to be chosen at purchase. In practice, this means consistent retargeting, strong product content, and frictionless re‑entry points (like autofill, wishlists, or reminders).
A key caveat: influence mapping is diagnostic, not deterministic. It tells you where influence exists, not how to exploit it. Use it to prioritize questions—not to justify fixed plans. The value lies in iteration: observe, adjust, repeat.
FAQs & objections
Isn’t this just “attribution” with new language?
No. Attribution models assign credit after a conversion; influence maps guide design before one. Attribution tells you where performance appeared; influence mapping shows where confidence was built. They complement each other but serve different moments in planning.
Will my ROAS drop if I rebalance away from high‑reach channels?
In the short term, maybe. Influence mapping shifts investment toward depth rather than breadth. ROAS may dip temporarily as dollars move into higher‑trust, lower‑reach touchpoints—but long‑term incrementality and profit tend to rise.
Can small brands use this too?
Absolutely. You don’t need big data; you need pattern recognition. Even simple survey data or UTM‑tagged campaigns can reveal where confidence grows fastest. Small teams often benefit most from the clarity an influence map provides.
How do I combine this with MMM or MTA?
Use MMM to validate your influence map statistically. MMM quantifies impact; your map visualizes it. The best marketers blend both—creative intuition backed by econometrics.
What if my leadership only understands funnels?
Translate it visually. Show how customers “loop” through discovery, evaluation, and purchase multiple times. Present influence mapping as an evolution, not a rebellion. People trust metaphors that connect old models to new logic.
The bigger picture
Funnels were built for a world where brands spoke and consumers listened. Influence maps fit a world where conversation drives choice. They honor the complexity of how people really decide—through loops of attention, relevance, and trust.
The brands that adopt influence mapping don’t just optimize spend; they optimize understanding. They see where their message lands, where it loses energy, and where it sparks belief. That insight reshapes everything—from creative briefing to budgeting to measurement.
The future of marketing isn’t linear. It’s dynamic, relational, and behavioral. Build your map, test your influence, and let the data tell you where persuasion truly happens. Funnels fade; influence flows.
Read similar content
Similar topics

Speed Is a Feature: Site, Support, and Delivery That Convert
Operational speed—page loads, helpful support, clear delivery—now decides who wins the cart.

Loyalty That Changes Behavior (Not Just Points)
Design rewards and service advantages that make people act differently—return more, spend more, advocate more.